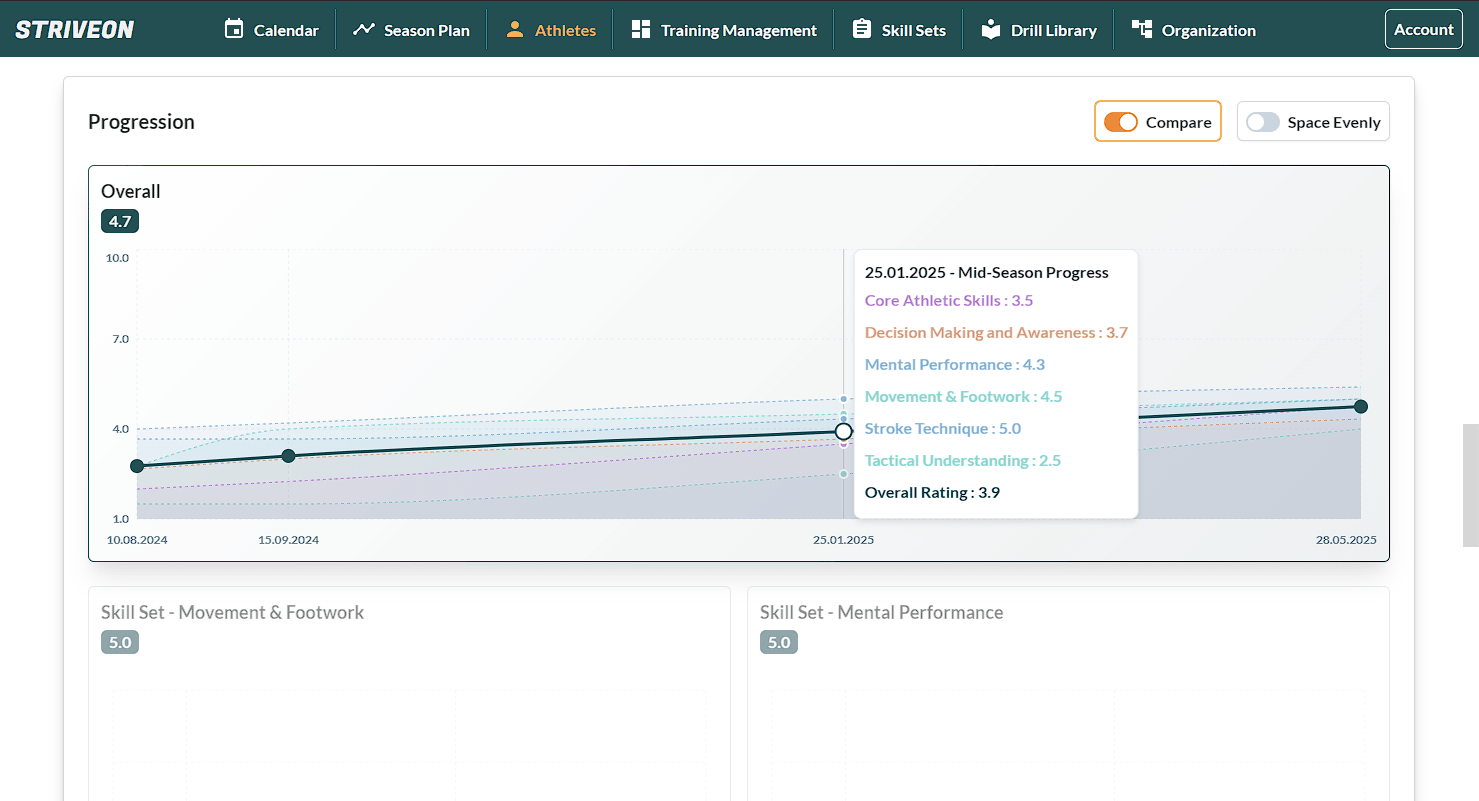
Every Rating Becomes a Progress Chart
Stop maintaining spreadsheets to track development. Striveon automatically builds interactive progress charts from every evaluation you create, showing clear improvement patterns in real-time.
See months of development at a glance. Athletes stay motivated watching their growth story unfold, and stakeholders see proof of your coaching impact instantly. Rate athletes naturally, charts build themselves.

Development Impact Proven in Charts
See your coaching impact in visual proof. When stakeholders ask about results, show them athlete growth charts instantly.
Motivation Through Visual Growth
Athletes see their improvement journey, not just numbers. Progress becomes tangible and exciting.
Everyone Sees Progress History Instantly
Everyone understands athlete progress without digging through old evaluation records. Complete transparency for all stakeholders.
Automatic Progress Visualization
From evaluation to interactive charts without any extra work
Coach Rates Skills
Evaluate athlete skills as usual. Each rating saves automatically with timestamp.
Averages Build Automatically
Skill set and overall ratings calculate in real-time from individual skill ratings.
Progress History Appears
Progress history builds itself when viewing athlete profile. All evaluations organized by date automatically.
Interactive Charts Load Instantly
Visual progress appears across all skills. Everyone can click skill categories to explore trends.
Athlete Development & Management
Progress Tracking visualizes your coaching impact as part of your complete development system. Athlete Development & Management unifies evaluations, skill frameworks, goal tracking, development roadmaps, coaching notes, and progress visualization in one platform where all tools sync automatically—eliminating separate spreadsheets and giving you complete athlete development oversight.
- Monitor athlete development across multiple teams and entire seasons
- Set and monitor development goals with automatic progress updates
- Plan future development with roadmaps connected to current performance
- Manage multiple teams and athletes from unified development hub
Key Connections
Athlete Evaluation
Every evaluation automatically adds data point to progress charts in real-time without extra steps.
Athlete Performance Testing
Test results feed directly into progress charts, showing objective improvement trends alongside skill ratings.
Skill Sets
Progress charts organize by your skill categories, showing overall progress down to individual skill trends.
Athlete Goals
Goals update automatically when evaluation ratings match targets, creating progress entries with evaluation notes.
Evaluation Criteria
Chart hover tooltips show your rating definitions automatically, ensuring everyone interprets progress values consistently.

Ready to See Automatic Progress Charts From Your Evaluations?
Stop maintaining spreadsheets. Start your free 14-day trial and watch progress charts build from your first evaluation. No credit card required.
